
Complete Visibility Into Employee App & Website Usage
Understand where employee time is spent with detailed application and website analytics, usage trends, overtime insights, employee-wise breakdowns, and exportable activity logs.
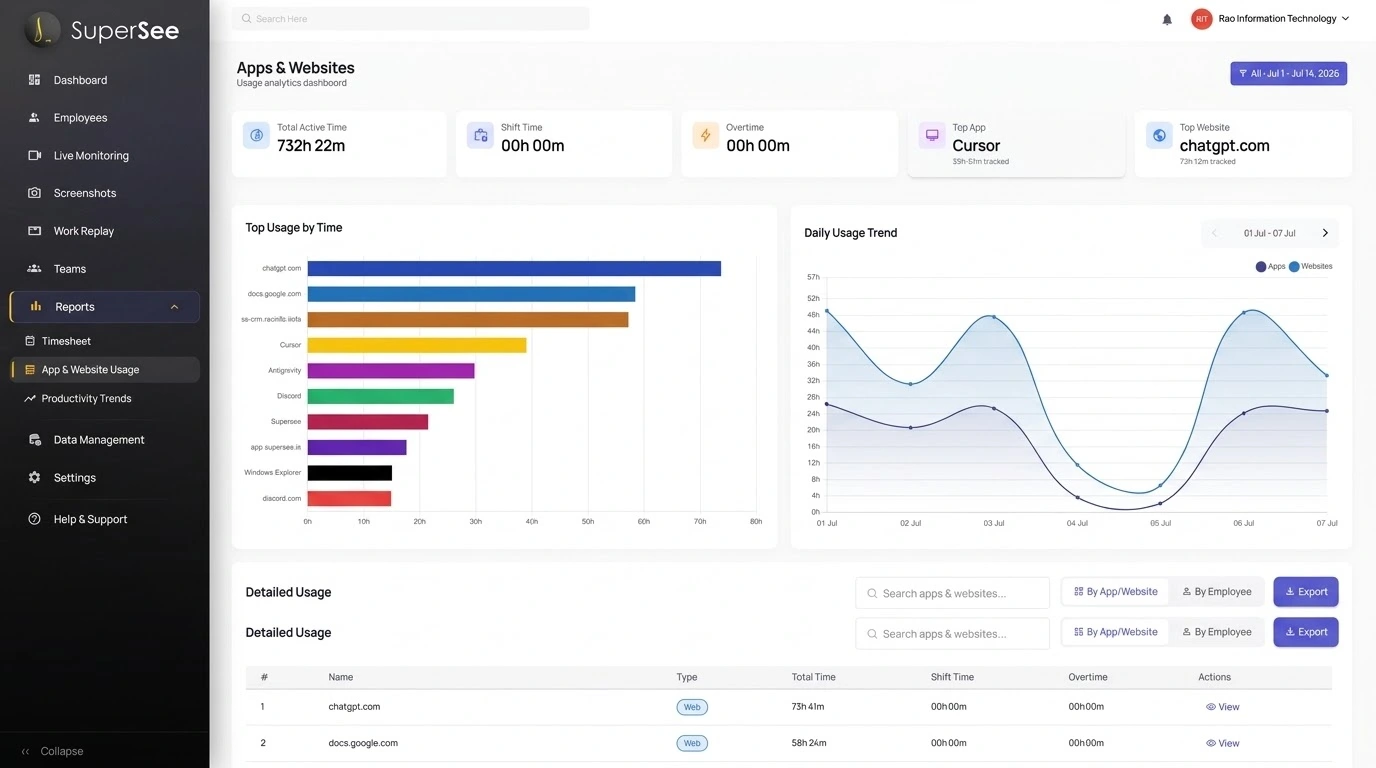
Understand Digital Work Patterns Across Your Organization
A single source of truth for how time is actually spent across every application and website your teams use.
Track Application Usage
Know which business applications employees use and for how long.
Track Website Usage
Understand website activity and identify productive and non-work browsing.
Measure Shift vs Overtime
Separate regular work hours from overtime activity.
Analyze Usage Trends
Identify usage patterns across teams, shifts, and departments.
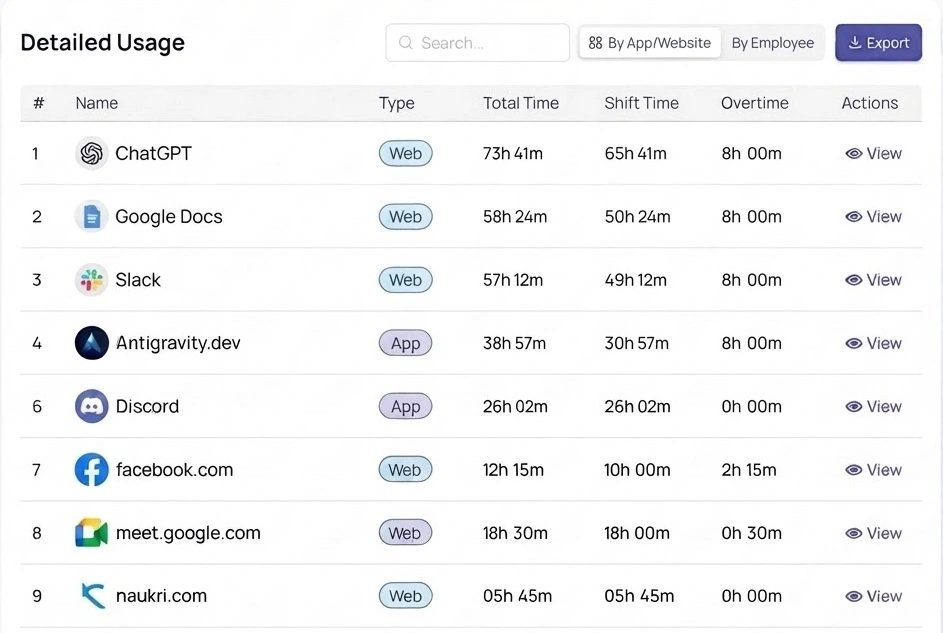
Everything You Need In One Dashboard
Managers get a complete overview of application and website utilization without switching between multiple reports.
| Employee | Top App | Top Site | Shift | Overtime |
|---|---|---|---|---|
| Shubham | VS Code | chatgpt.com | 42h 10m | 06h 14m |
| Indrajeet | Slack | github.com | 38h 02m | 02h 50m |
| Himani | Excel | notion.so | 40h 33m | 01h 22m |
| Maharshi | Outlook | jira.atlassian | 36h 18m | 00h 48m |
Analyze Data Your Way
Instantly drill down into the exact data set you want to analyze — from a single employee on a night shift to organization-wide weekend productivity.
- Combine app, website, employee, team and shift filters
- Compare against previous week or month instantly
- Switch between Flexible and Strict counting modes
Know Which Applications Drive Productivity
See the apps fueling real work and the ones quietly draining time. Spot software adoption, unused licenses, and bottlenecks.
Identify business-critical tools
Understand software adoption
Discover unused licenses
Detect productivity bottlenecks
Gain Visibility Into Website Activity
Understand digital behavior across your workforce — research, collaboration, and non-work browsing trends — all in one place.
- Most visited websites with total time spent
- Website rankings by team and shift
- Shift vs. overtime browsing breakdown
See Usage Distribution Across Employees
Instantly identify power users, adoption levels, and employee engagement with any application or website.
Track Usage Day By Day
Understand exactly when application and website activity occurred. Spot workload spikes, unusual patterns, and operational trends.
| Date | Employee | Total Time | Shift Time | Overtime | Sessions |
|---|---|---|---|---|---|
| 24 Nov 2026 | Shubham | 09h 12m | 08h 00m | 01h 12m | 32 |
| 24 Nov 2026 | Indrajeet | 08h 41m | 08h 00m | 00h 41m | 28 |
| 23 Nov 2026 | Himani | 07h 58m | 07h 58m | 00h 00m | 21 |
| 23 Nov 2026 | Maharshi | 09h 33m | 08h 00m | 01h 33m | 36 |
| 22 Nov 2026 | Ankit | 06h 12m | 06h 12m | 00h 00m | 18 |
| 22 Nov 2026 | Priya | 08h 04m | 08h 00m | 00h 04m | 25 |
| 21 Nov 2026 | Shubham | 10h 22m | 08h 00m | 02h 22m | 41 |
Export Every Activity Record
Every application launch. Every website visit. Every activity session. Every second of tracked usage — exportable to Excel for deeper analysis.
- Detailed records
- Employee information
- Date & time stamps
- App & website usage logs
- Shift & overtime calculations
- Full historical records
If even a single second is spent on an application or website, it is recorded and available for reporting and export.
| # | Date | Time | Employee | Type | App / Website | Duration | Category |
|---|---|---|---|---|---|---|---|
| 1 | 24-11-2026 | 09:14:22 | Shubham | App | Visual Studio Code | 01:42:18 | Development |
| 2 | 24-11-2026 | 10:56:40 | Shubham | Website | github.com | 00:48:02 | Development |
| 3 | 24-11-2026 | 11:44:42 | Indrajeet | App | Slack | 00:22:15 | Communication |
| 4 | 24-11-2026 | 12:06:57 | Himani | Website | notion.so | 01:12:30 | Documentation |
| 5 | 24-11-2026 | 13:19:27 | Maharshi | App | Microsoft Excel | 02:04:51 | Operations |
| 6 | 24-11-2026 | 15:24:18 | Ankit | Website | jira.atlassian.com | 00:36:44 | Project Mgmt |
| 7 | 24-11-2026 | 16:01:02 | Priya | App | Outlook | 00:18:09 | Communication |
| 8 | 24-11-2026 | 18:42:11 | Shubham | Website | chatgpt.com | 00:54:36 | Research |
Why Organizations Use App & Website Utilisation
Improve Workforce Visibility
A clear picture of how every team's time is spent.
Understand Tool Adoption
See which apps employees actually use day-to-day.
Measure Digital Activity
Every click, launch, and visit accurately tracked.
Analyze Work Patterns
Surface trends across shifts, teams, and departments.
Optimize Software Investments
Reclaim spend on unused licenses and subscriptions.
Support Data-Driven Decisions
Lead with evidence, not assumptions.
Track Shift & Overtime Usage
Differentiate scheduled hours from overtime.
Generate Audit-Ready Reports
Complete logs, exportable any time you need them.
Explore More SuperSee Features
Productivity Trends
See what is changing across your workforce over time.
Learn more →Live Monitoring
See real-time workforce activity as it happens.
Learn more →Work Replay
Replay workday sessions to investigate behavior in context.
Learn more →Automated Timesheets
Accurate timesheets generated automatically from activity.
Learn more →Turn Digital Activity Into Actionable Insights
Get complete visibility into application usage, website activity, work patterns, and employee engagement from a single platform.