Productivity Trends: What Attendance, Timesheets, and Task Tools Can’t Show
Most founders already have data.
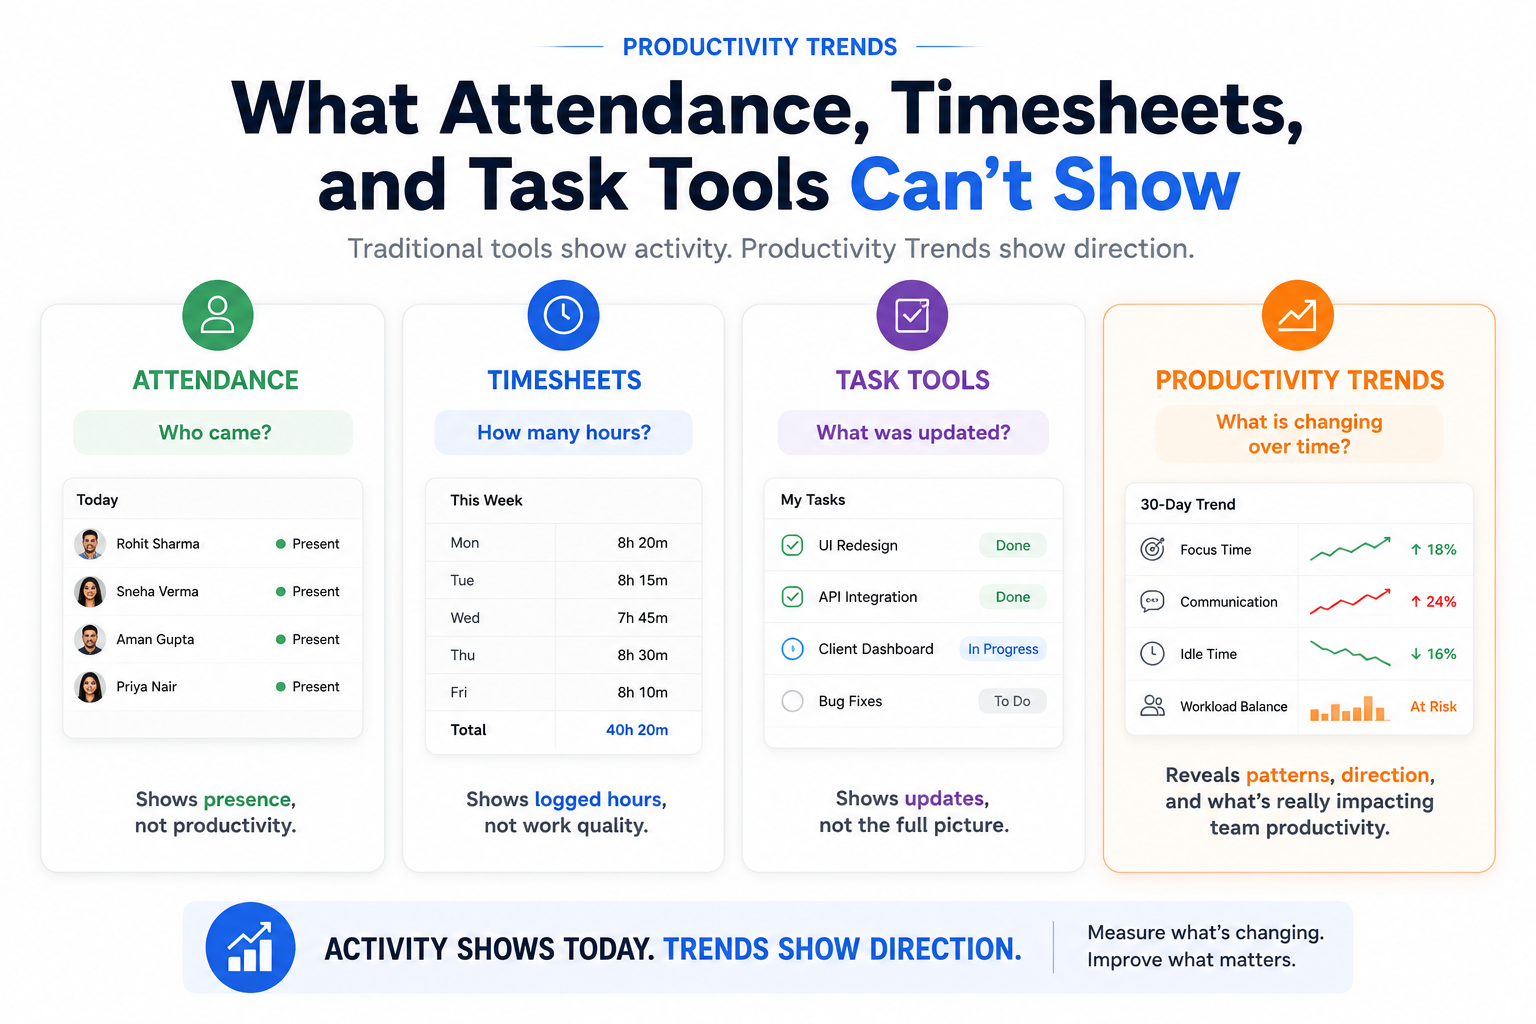
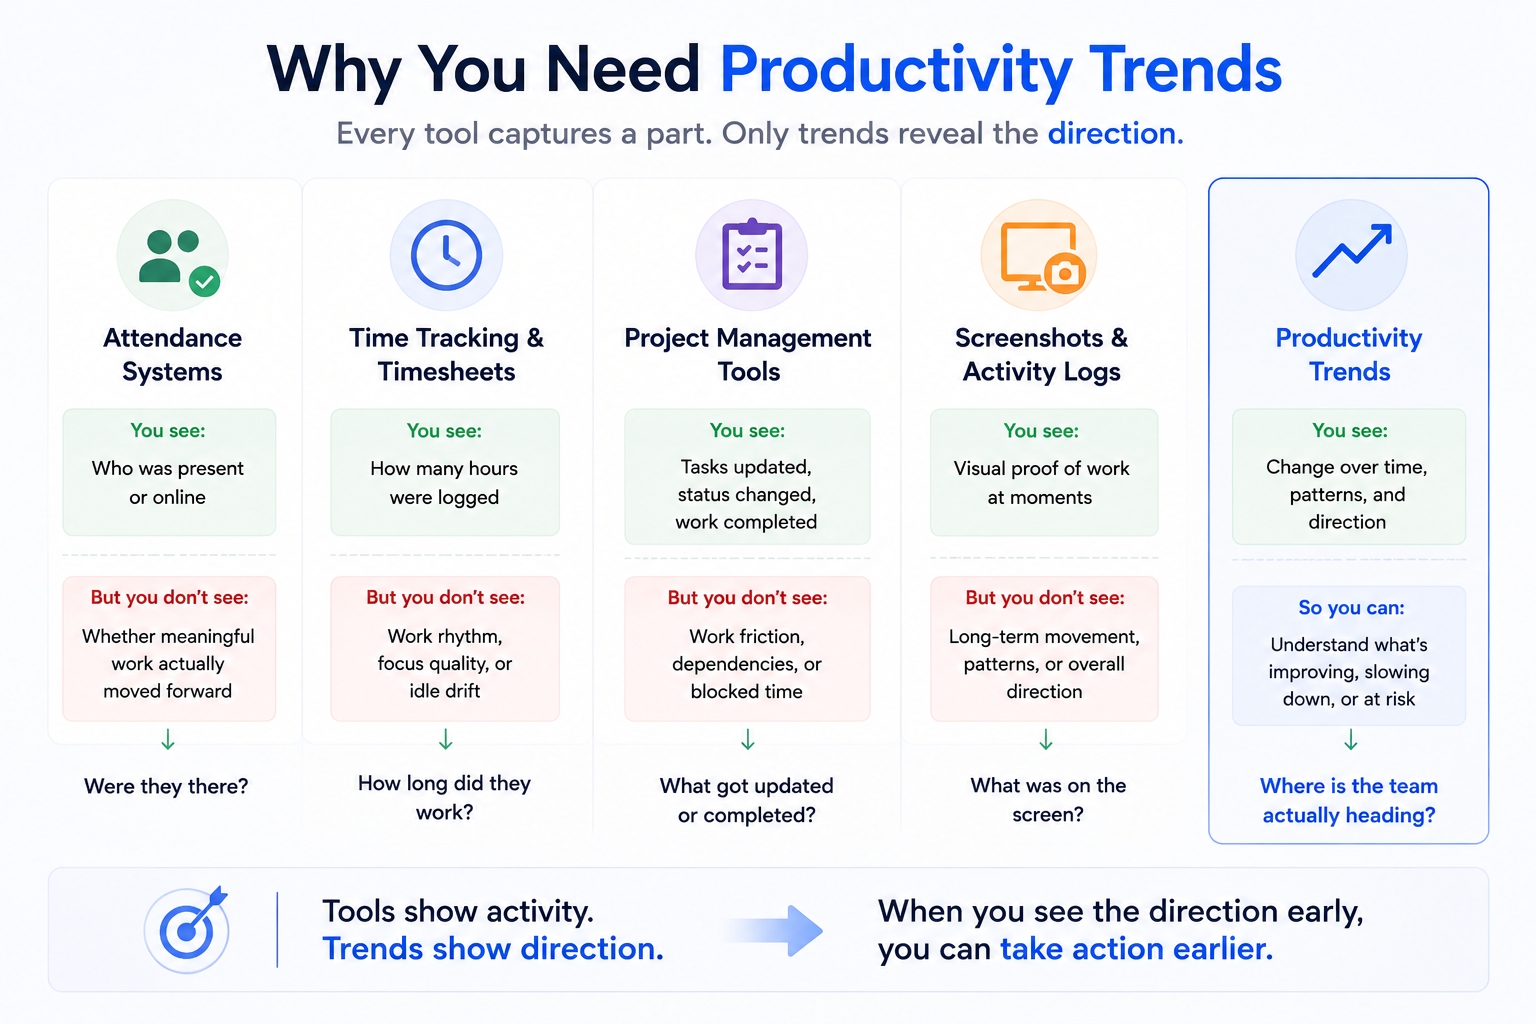
Attendance tells them who came. Timesheets show how many hours were logged. Task tools show what was assigned and updated. Calendars show meetings. Chat tools show activity. Some companies also use screenshots, app usage reports, or productivity tracking software.
Still, the founder is left with one uncomfortable question:
“If everyone is active, why is output still not moving?”
The issue is not lack of data. The issue is lack of direction.
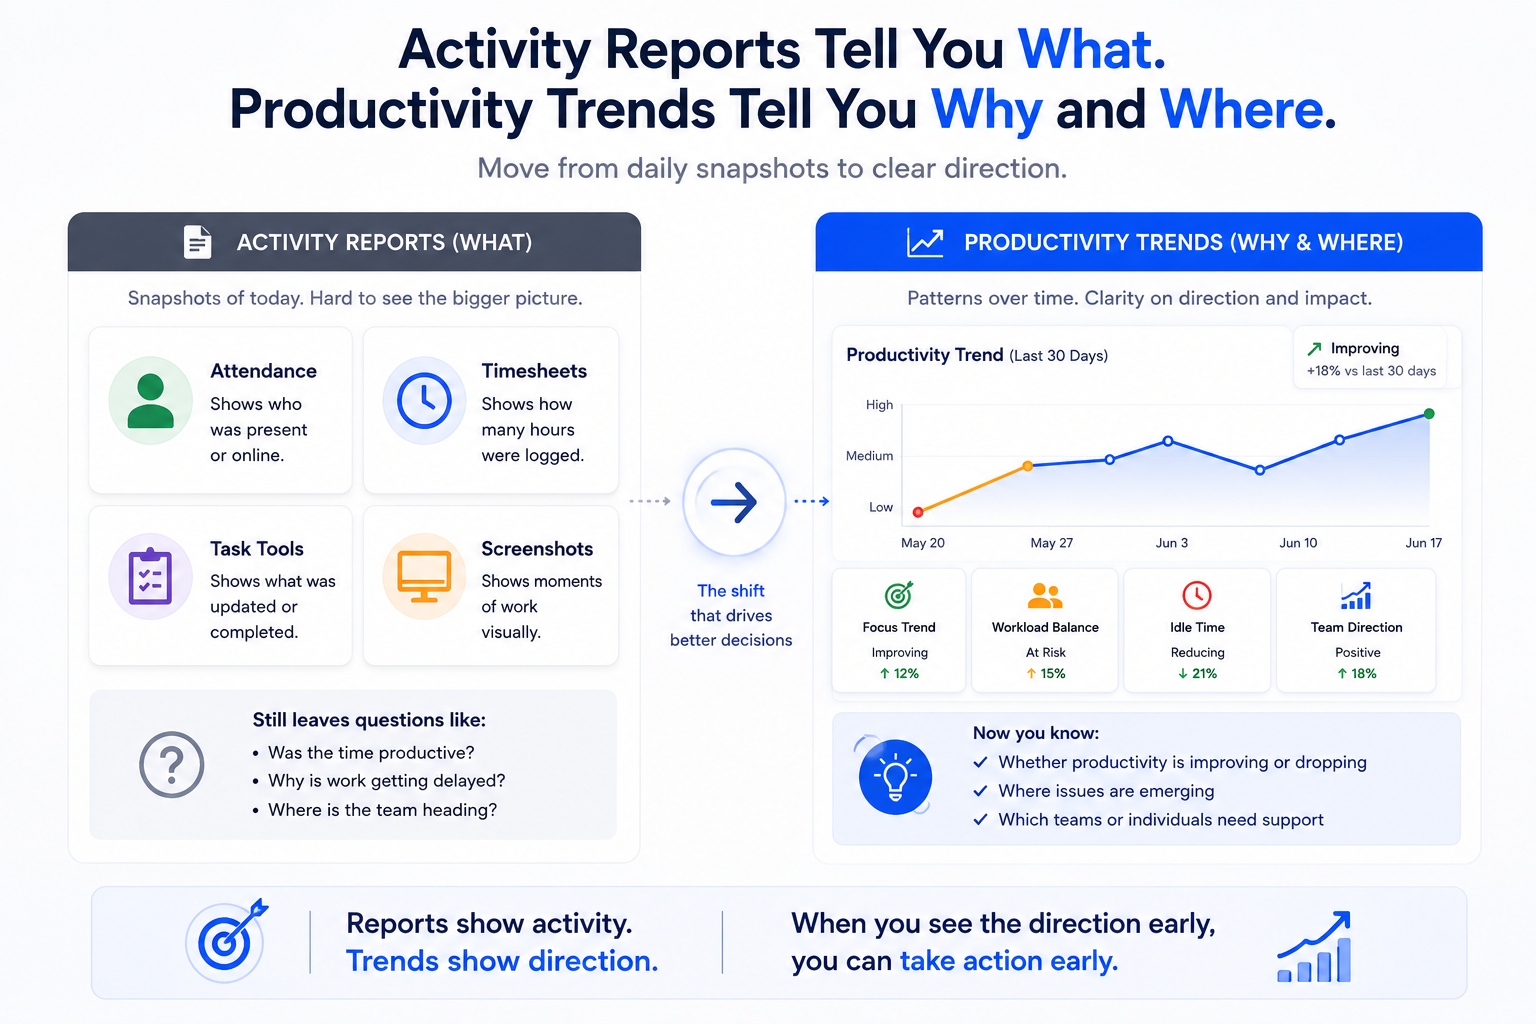
Daily reports show what happened today. Productivity trends show whether the team’s work pattern is improving, declining, or becoming unstable.
That difference is important for growing companies. A team can look active in the daily view and still become weaker over a month. Hours can look complete while focus time is shrinking. Task tools can look updated while the actual workday is getting fragmented.
This is where employee productivity analytics must move beyond logs and into pattern interpretation.
A team productivity dashboard that only shows today’s status can tell you if people were active. A productivity trends dashboard helps you understand whether that activity is turning into progress.
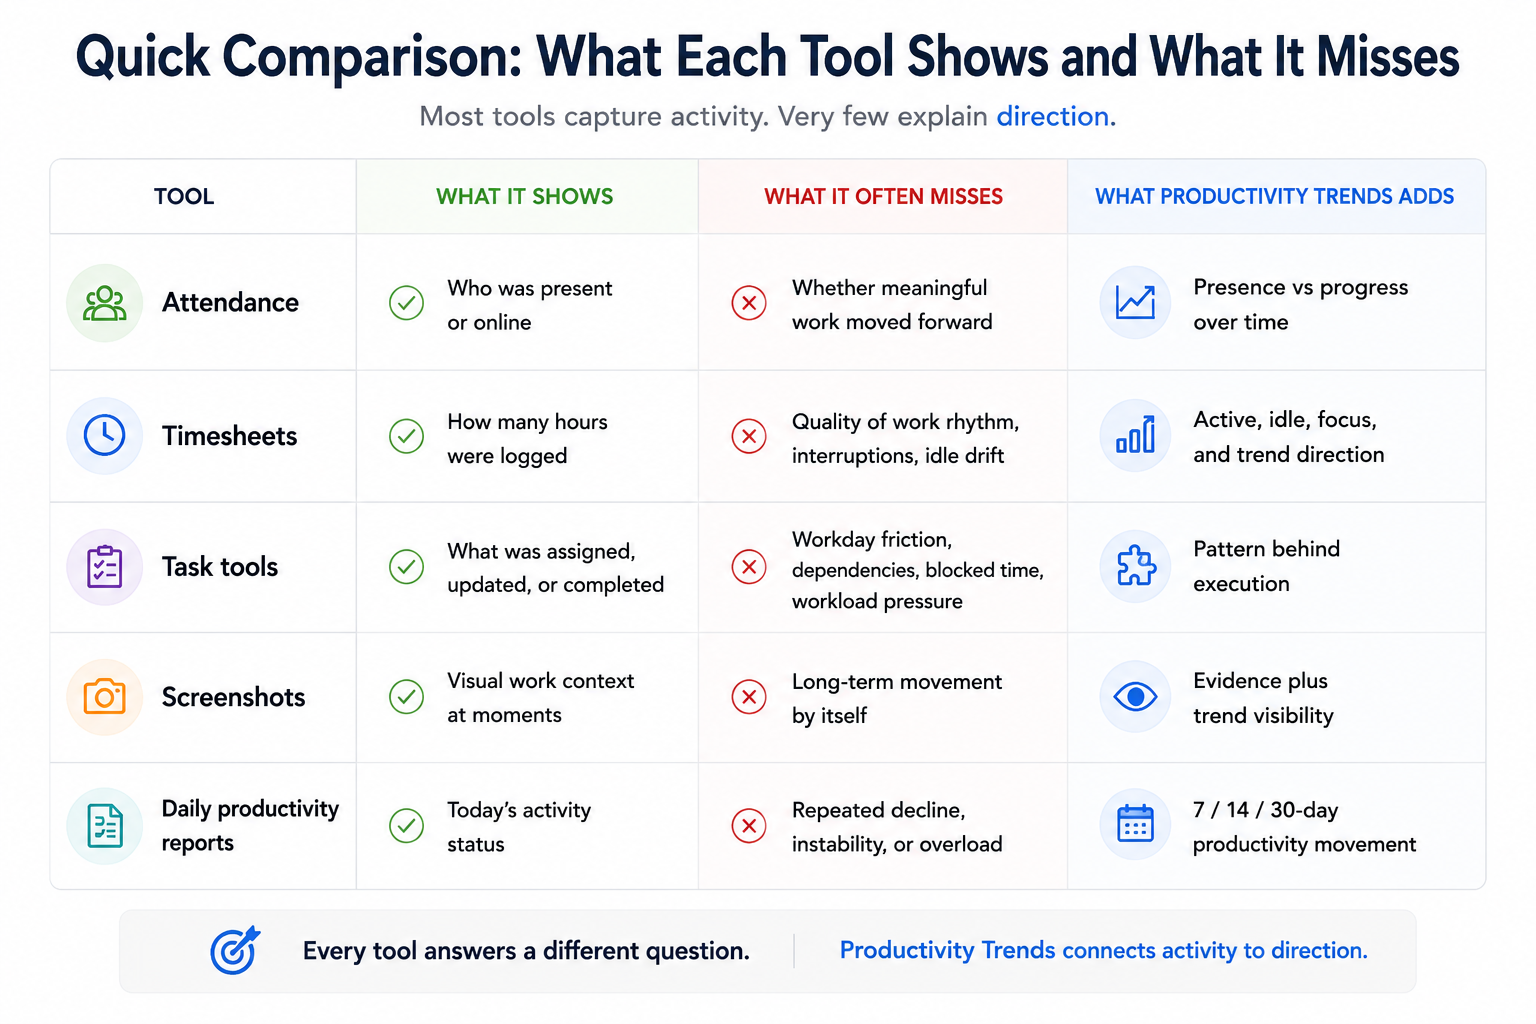
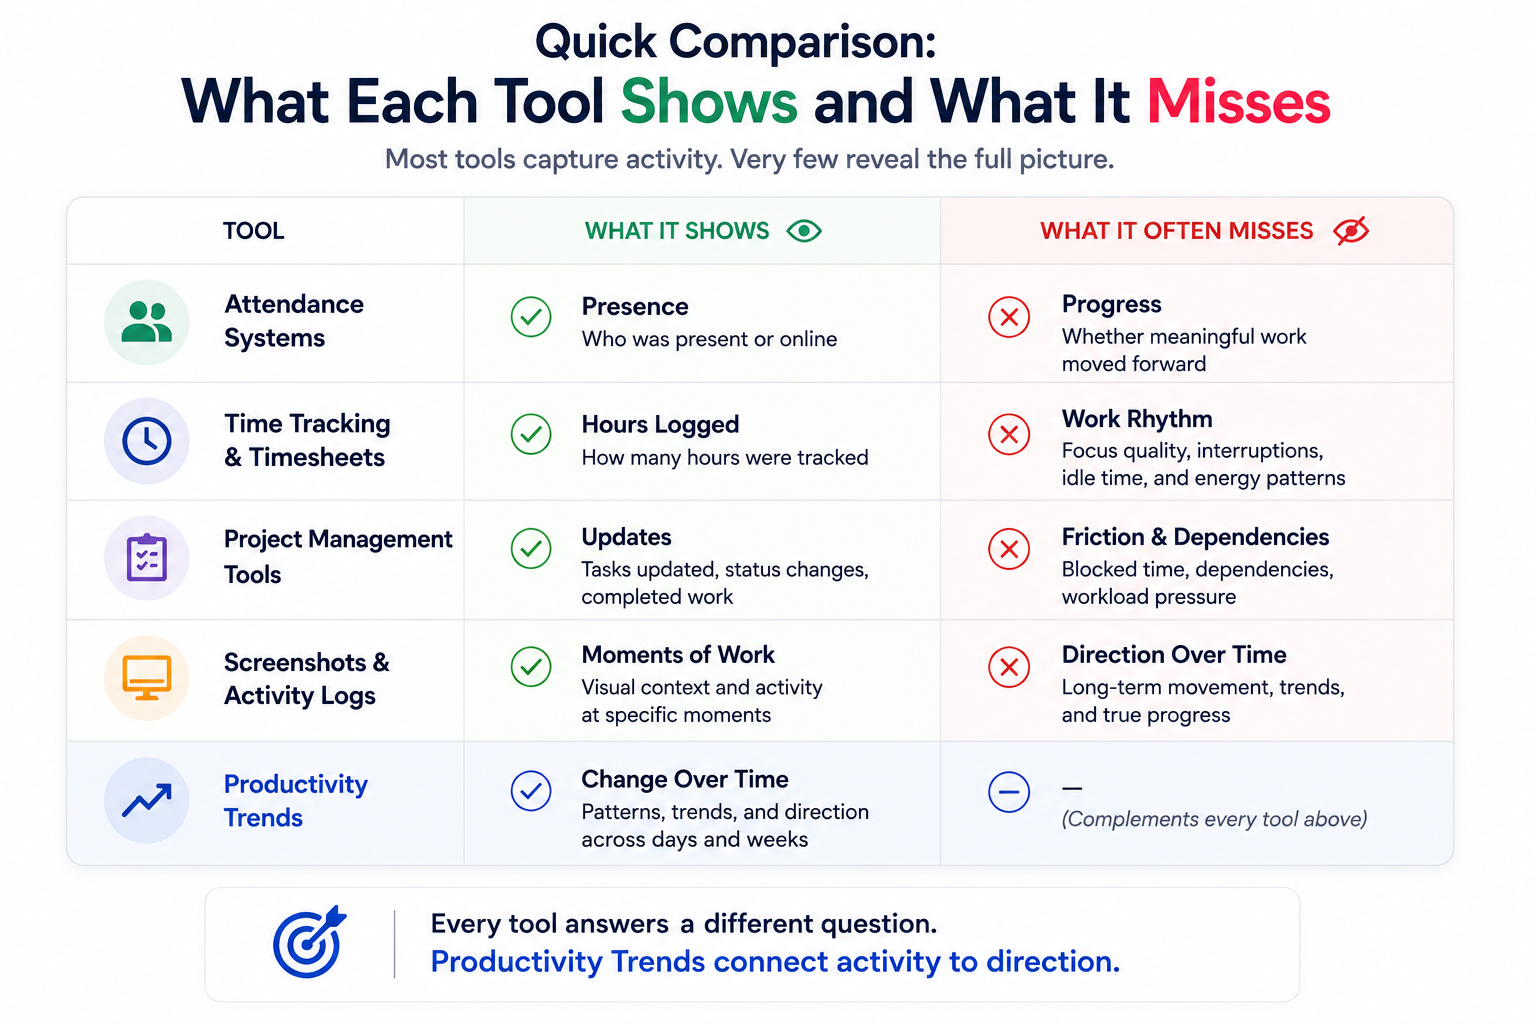
Quick comparison: what each tool shows and what it misses
This comparison matters because most founders do not need another report for the sake of reporting.
They need a clearer answer to one question:
Is the team’s work becoming healthier, stable, or harder to convert into output?
The limit of attendance: who came vs what moved
Attendance is useful. It answers a basic operational question: who showed up?
For payroll, compliance, shift planning, and basic accountability, that matters. But attendance has a hard limit. It confirms presence, not productivity.
An employee can be present and still be blocked. A remote employee can appear online and still be fragmented by meetings. An office team can sit in the same building and still lose time because priorities are unclear, approvals are slow, or managers need repeated follow-ups.
Presence gives comfort because it is easy to see.
But presence does not prove progress.
This is why founders often feel stuck. Attendance looks normal, but delivery still slips. The attendance tool did its job. It answered “who came?” It was never designed to answer “is work moving?”
The limit of timesheets: hours logged vs outcomes
Timesheets answer a different question: how many hours were recorded?
That is useful for billing, payroll, compliance, and basic time discipline. But full hours can still hide broken work rhythm.
An eight-hour day can include:
- Three hours of focused work.
- Two hours of meetings.
- One hour waiting for approval.
- One hour switching between chats, tools, and requests.
- One hour doing low-priority work because the real blocker was not removed.
On paper, the timesheet looks complete. In reality, the useful output may be far lower than expected.
This does not mean timesheets are bad. It means timesheets are incomplete when they are treated as productivity proof.
Most productivity tracking software stops at hours, activity, screenshots, or task updates. That gives a useful record. But a record is not the same as interpretation.
A founder needs to know whether those hours are becoming more focused, more fragmented, more overloaded, or more stable over time.
That is the job of productivity trends.
The limit of task tools: updates vs work patterns
Task tools are essential for delivery management. Jira, Asana, Trello, ClickUp, Monday, and similar systems help teams organize work, assign ownership, set deadlines, and track status.
But task tools depend on human updates. They show the work item, not always the workday.
A task can sit “in progress” for three days, but the task board may not explain:
- Was the employee blocked by a dependency?
- Was the person pulled into urgent client work?
- Did meetings break the day into small fragments?
- Was the task waiting for approval?
- Did unclear requirements create repeated rework?
- Was one high performer carrying the invisible coordination load?
- Was the whole team overloaded, or just one employee?
This distinction is important.
Task tools are excellent at showing reported progress.
They are weaker at showing work friction.
For a founder, that friction is often where the real productivity loss hides.
Productivity trends answer a different question: what is changing?
Productivity trends are not a replacement for attendance, timesheets, or task tools.
They answer a different management question:
What is changing over time?
That question is often the missing layer in founder-led companies.
A daily dashboard can show who is online today. A timesheet can show how many hours were logged. A task tool can show which tickets moved. But none of those alone tells the founder whether the team’s work pattern is improving, stable, or declining.
Direction matters more than one-day status.
A team may have a slow day and still be healthy. Another team may look active every day while gradually losing focus blocks, increasing communication overhead, and creating workload pressure around a few people.
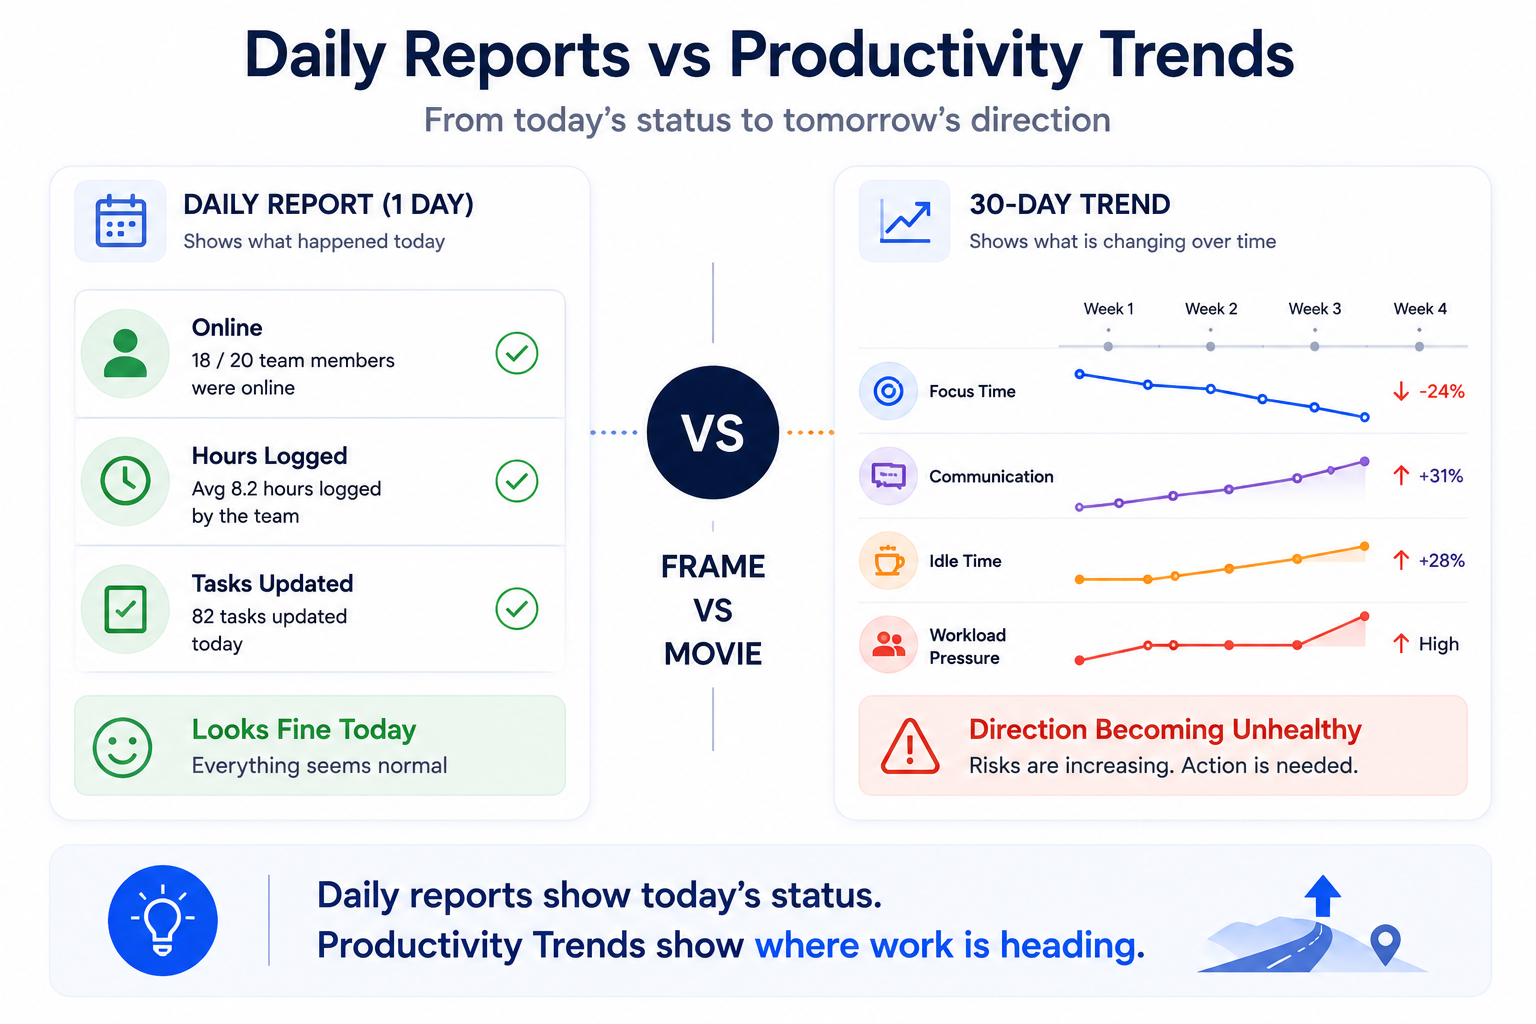
Daily reports show the frame.
Productivity trends show the movie.
That is why solution-aware buyers should not ask, “Do we need this instead of timesheets?”
The better question is:
“Can our current tools show whether productivity is getting better or worse?”
Soft CTA:
See your first 30-day productivity trend in SuperSee and check whether your team’s work pattern is improving, stable, or silently declining.
When attendance and timesheets are not enough
You do not need Productivity Trends just because you want more dashboards.
You need them when daily status is no longer enough to explain delivery reality.
Here are the clearest signs:
- Attendance is normal, but delivery is slipping.
- Timesheets show full hours, but output feels weak.
- Task tools are updated, but work still feels delayed.
- Managers are chasing more than they are solving.
- A few employees are carrying most of the execution load.
- Remote or hybrid teams are active but hard to understand.
- Meeting and communication load is rising without better speed.
- You need to know whether productivity is improving, stable, or declining.
This is the difference between daily activity reporting and workforce productivity analytics.
Daily reporting tells you what happened.
Workforce productivity analytics helps you understand what the pattern means.
5 patterns a team productivity dashboard should reveal
A strong team productivity dashboard should not simply show who is online or how many hours were logged. It should help founders make better operational decisions.
Here are five patterns that matter.
1. Which teams are quietly improving?
Not every team that needs attention is failing. Some teams may be improving slowly before the results become visible in delivery. Productivity trends help founders see where momentum is building, so they can understand what is working and repeat it elsewhere.
2. Which teams are losing focus?
For developers, designers, writers, analysts, finance teams, and back-office teams, deep work is not a luxury. It is where serious output happens. If focus blocks are shrinking, a team can look active while producing less meaningful progress.
3. Is communication helping delivery or eating the workday?
Communication is necessary. But if meetings, chats, and coordination keep rising without better output, the team may be using communication to compensate for unclear processes, slow approvals, or poor handovers.
4. Is workload pressure becoming concentrated?
In many growing companies, reliable employees silently become the backup system. They answer faster, solve more problems, and absorb more coordination. From the outside, the team looks stable. Inside, the workload is becoming unhealthy.
Productivity trends help founders spot this before the best people burn out or become bottlenecks.
5. Is the work rhythm becoming unstable?
A single unusual day is normal. A repeated drift in start patterns, idle patterns, focus rhythm, communication load, or end-of-day behavior is more meaningful. These rhythm shifts often appear before missed deadlines.
This is why employee productivity analytics must be interpreted as a trend, not as a one-day judgment.
What SuperSee Productivity Trends helps you see
SuperSee Productivity Trends helps founders and operations leaders move beyond daily status checks.
Attendance can show presence. Timesheets can show tracked hours. Task tools can show reported progress. But SuperSee connects work activity with longer-term patterns such as active time, idle time, focus rhythm, communication load, workload pressure, team-level movement, employee signals, and work rhythm changes.
This helps leaders ask better questions earlier:
- Is this team overloaded?
- Is focus time reducing?
- Is idle share increasing?
- Are a few employees carrying too much?
- Is communication helping delivery or eating the workday?
- Is the team’s productivity improving, stable, or silently declining?
SuperSee is not meant to replace your attendance, payroll, HRMS, or task management tools.
It acts as a work visibility layer over the reality of the workday.
Keep attendance for presence.
Keep timesheets for hours.
Keep task tools for execution planning.
Use SuperSee Productivity Trends for direction.
That is the strategic distinction.
Most tools tell you what happened. Productivity Trends tells you whether that “what” is getting better, worse, or stable.
That is how founders stop only reporting on the past and start managing earlier.
Why this is workforce visibility, not micromanagement
Workforce visibility is not the same as micromanagement.
Micromanagement asks people to justify every minute.
Workforce visibility helps leaders understand where work is blocked, fragmented, overloaded, or losing rhythm.
The difference is how the data is used.
The wrong use is to turn every activity signal into blame.
The right use is to diagnose the work system:
- If focus time is falling, ask what is breaking concentration.
- If communication load is rising, review clarity, handovers, and approval flow.
- If idle share is increasing, check whether people are waiting on inputs.
- If workload pressure is uneven, redistribute before good employees burn out.
- If a team’s rhythm is drifting, understand the cause before judging the person.
This is why SuperSee should be positioned as context before blame, not control before trust.
No productivity report should become the entire judgment of an employee. It should become the start of a better management conversation.
Practical founder example: the 40-person service team
Imagine a 40-person service business.
Attendance is normal. Timesheets are filled. The task board is active. Managers are sending updates. On paper, the company looks disciplined.
But delivery is getting harder.
The founder feels it before the dashboard proves it. Deadlines are moving. Client follow-ups are increasing. Managers are asking for more meetings. A few high performers are always busy. The team is not absent, but momentum feels weaker.
Without productivity trends, the founder may only discover the real issue after a client escalates.
With SuperSee, the founder can look at the pattern:
- Did focus time drop over the last 30 days?
- Did the communication load rise before delivery slowed?
- Did one team show increasing idle drift?
- Did workload pressure concentrate around a few employees?
- Did the work rhythm become more fragmented?
This changes the management conversation.
Instead of saying, “Why is the team slow?” the founder can ask, “Which part of the work system is slowing the team down?”
That is a more useful question.
It leads to better decisions.
Where SuperSee fits in your management stack
A strong operating system does not depend on one tool for everything.
Each tool has a job:
- Attendance confirms who came.
- Timesheets record hours.
- Task tools organize deliverables.
- App and website reports show where computer time goes.
- Screenshots and Work Replay provide context when evidence is needed.
- Live Screencast helps during critical real-time moments.
- Productivity Trends shows direction over time.
The mistake is expecting attendance, timesheets, or task tools to answer a question they were not built to answer.
They are useful.
They are just incomplete.
Productivity Trends fills the gap between daily activity and operational direction.
That is why this article is not asking founders to remove their current tools.
It is asking them to add the missing layer:
Direction.
If your team is active but output is unclear, check the trend.
CTA:
Check your first productivity trend with SuperSee.
Start a 14-day SuperSee trial and see whether your team’s productivity is improving, stable, or silently declining.
FAQ
Do productivity trends replace timesheets?
No. Timesheets show hours logged. Productivity trends show whether those hours are becoming more focused, fragmented, overloaded, or stable over time. Both answer different questions.
How are productivity trends different from a dashboard?
A dashboard usually shows current or daily status. Productivity trends show direction over time, such as whether focus time is falling, workload pressure is rising, or a team’s rhythm is changing.
Do productivity trends replace task management tools?
No. Task tools show assigned, updated, and completed work. Productivity trends show the work pattern behind execution, including focus, communication load, idle drift, and workload pressure.
Is this workforce visibility or employee monitoring?
It depends on how the data is used. SuperSee should be used as workforce visibility: a way to understand blockers, workload, focus loss, and work rhythm. The goal is better context and support, not fear-based monitoring.
What should founders check first in a productivity trends dashboard?
Start with team-level direction: active time movement, idle share, focus time, communication load, workload pressure, and sudden rhythm changes. These signals help identify whether productivity is improving, stable, or declining.
Can productivity trends help office teams too?
Yes. Office presence does not automatically mean work clarity. Office teams also face meetings, interruptions, unclear ownership, waiting time, uneven workload, and fragmented focus. Productivity trends can reveal those patterns.